Cities with the Greatest Home Value Surges (2021)
The price isn’t always right, especially for homebuyers in these twenty cities, whose home prices experienced the highest monthly hikes in the nation this year.
It’s never easy buying a house, and in certain cities, real estate is coming at an increasingly higher cost, now more than ever. Following the onset of the pandemic, real estate markets across the country collectively saw a boom in demand from buyers. As demand for homes has gone up, the price tags on new properties have increased in turn—in 2020, the average home value increased by 6.5% over the year, according to Insurify’s analysis.
A house is always an investment, but certain markets are demanding even more from prospective homeowners this year. To see where new homes are becoming more expensive than ever, the researchers at Insurify turned to real estate statistics from Realtor.com to identify the twenty cities with the greatest rise in home prices over the past year.
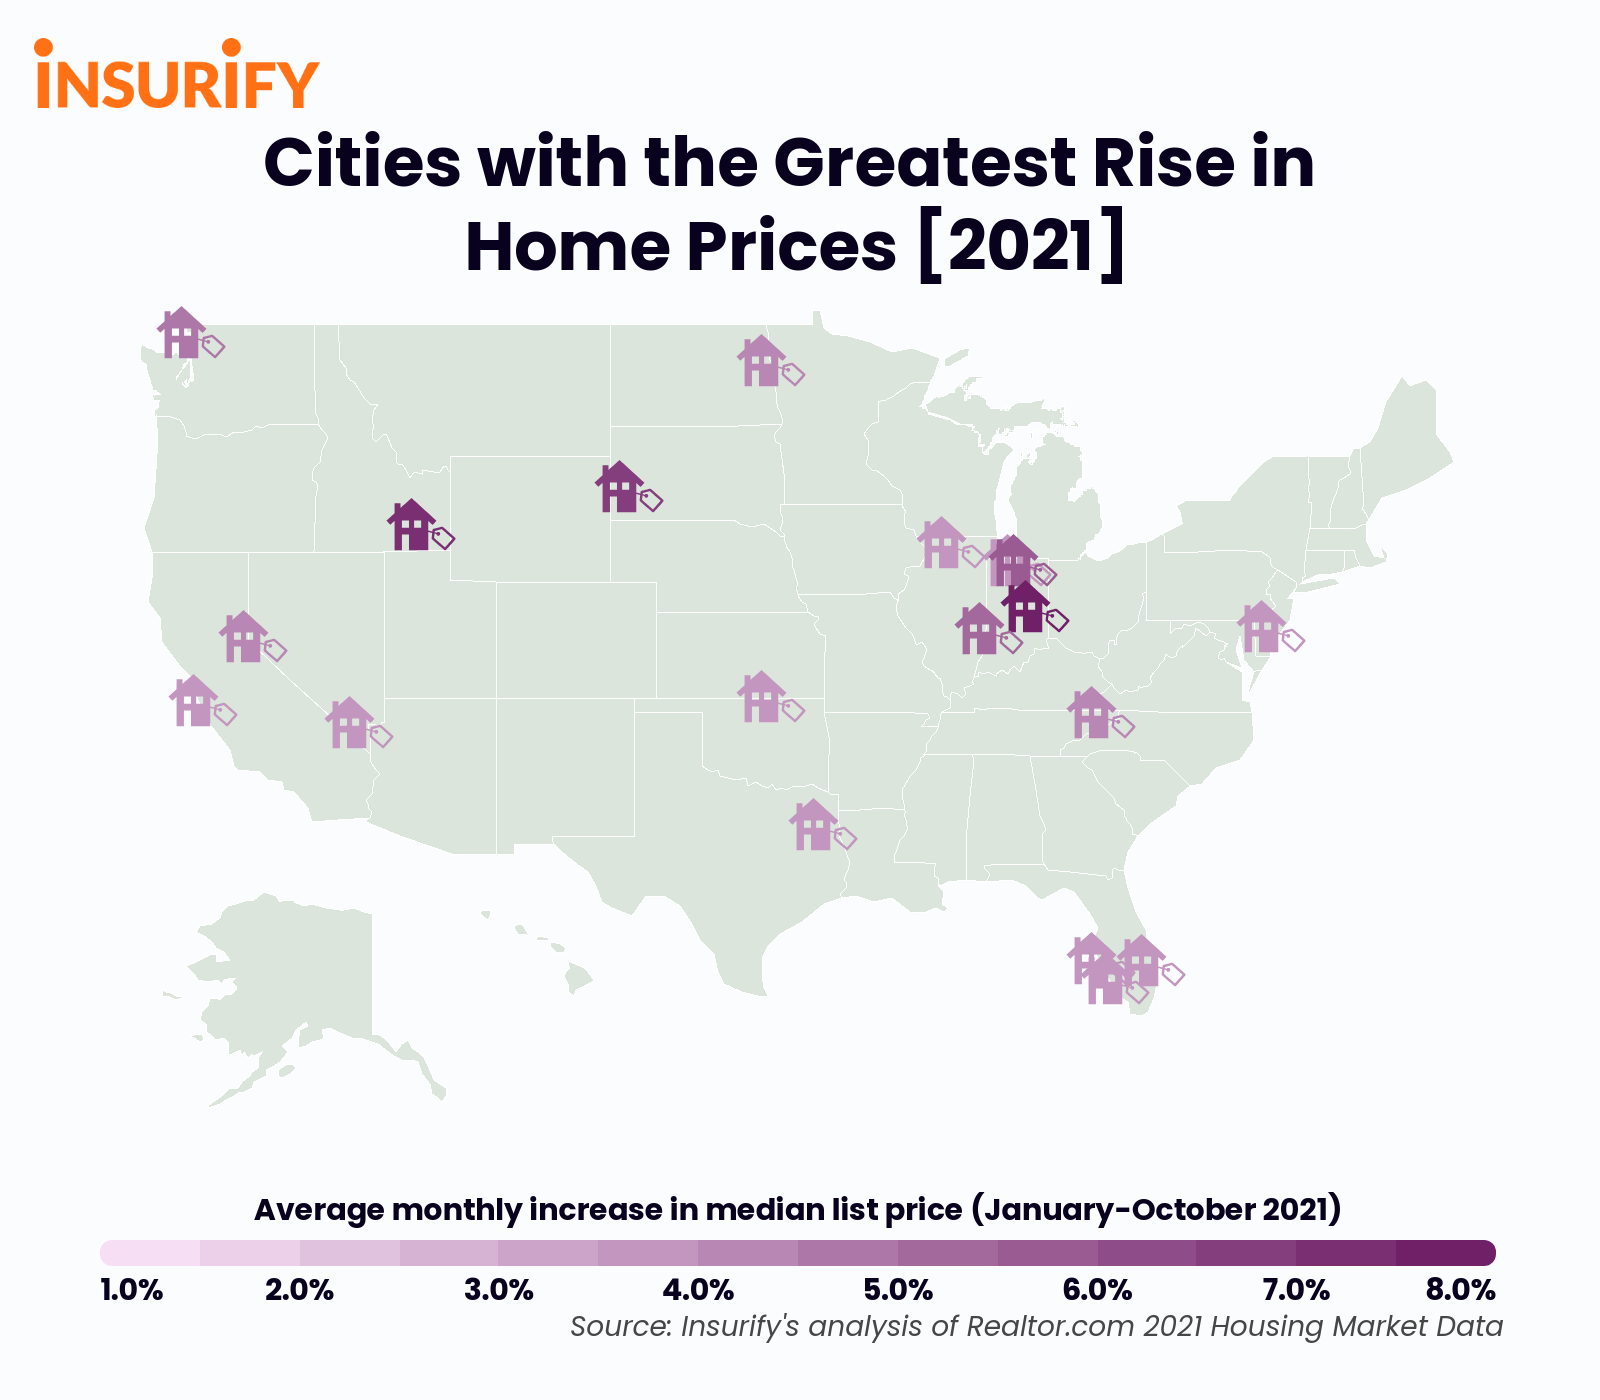
Insights
- National averages. List prices across U.S. real estate markets increased by an average of +0.6% monthly between January and October 2021. As of October 2021, the average list price for real estate on the market in the United States is $393,626.
- Hoosiers paying increasingly higher prices for homes. Indiana is the most represented state in the rankings, with four out of the twenty cities with the greatest rise in home prices local to the Hoosier State. On the state level, Indiana’s overall average monthly increase in list prices is the eighth-highest in the nation in 2021: at +1.6%, home prices in Indiana have been increasing monthly at a rate nearly 3x the national average.
- Home prices rising across the nation. The cities that experienced the highest monthly increases in home prices in 2021 are not limited to one geographic region but are spread throughout the nation. From the highest point of the Pacific Northwest to the Floridian coasts, house list prices are on a positive—and expensive—trajectory in 2021.
Methodology
The research team at Insurify, a site to compare home insurance, analyzed real estate market statistics from Realtor.com to determine the twenty cities with the highest house price hikes in 2021.
Realtor.com provides monthly real estate metrics across multiple geographic levels in the United States, including the median listing price for homes on the market. Researchers calculated the average percent change in median listing price month-over-month across 383 U.S. metropolitan areas from January through October 2021. The twenty cities with the highest average percent increase in real estate prices during this time period were identified as the cities with the greatest rise in home prices in 2021.
In this study, cities were designated using the United States Census Bureau’s classification of an “urbanized area,” defined as an urban area with a population over 50,000.

Where did home values rise the most in 2021?
Between January and October 2021, the list price of homes on the market in Muncie, Indiana increased monthly by an average of 7.37%, marking the highest month-over-month rise in property prices in the nation.
20 Cities with the Greatest Rise in Home Prices, 2021
20. Akron, Ohio
- Average monthly list price increase in 2021: +2.54% (4.2x greater than the national average)
- Median list price (October 2021): $179,900
- Statewide monthly list price increase: +0.2% (30th in the nation)
19. Arkansas City-Winfield, Kansas
- Average monthly list price increase in 2021: +2.55% (4.3x greater than the national average)
- Median list price (October 2021): $124,900
- Statewide monthly list price increase: +0.4% (26th in the nation)
18. Vineland, New Jersey
- Average monthly list price increase in 2021: +2.56% (4.3x greater than the national average)
- Median list price (October 2021): $199,900
- Statewide monthly list price increase: +0.2% (31st in the nation)
17. North Port-Sarasota-Bradenton, Florida
- Average monthly list price increase in 2021: +2.56% (4.3x greater than the national average)
- Median list price (October 2021): $495,000
- Statewide monthly list price increase: +2.3% (4th in the nation)
16. Cape Coral-Fort Myers, Florida
- Average monthly list price increase in 2021: +2.67% (4.5x greater than the national average)
- Median list price (October 2021): $430,000
- Statewide monthly list price increase: +2.3% (4th in the nation)
15. South Bend, Indiana
- Average monthly list price increase in 2021: +2.70% (4.5x greater than the national average)
- Median list price (October 2021): $215,000
- Statewide monthly list price increase: +1.6% (8th in the nation)
14. Las Vegas-Henderson-Paradise, Nevada
- Average monthly list price increase in 2021: +2.73% (4.6x greater than the national average)
- Median list price (October 2021): $439,000
- Statewide monthly list price increase: +2.6% (3rd in the nation)
13. Rockford, Illinois
- Average monthly list price increase in 2021: +2.77% (4.6x greater than the national average)
- Median list price (October 2021): $169,900
- Statewide monthly list price increase: +0.7% (17th in the nation)
12. Port St. Lucie, Florida
- Average monthly list price increase in 2021: +2.79% (4.7x greater than the national average)
- Median list price (October 2021): $415,000
- Statewide monthly list price increase: +2.3% (4th in the nation)
11. Santa Cruz-Watsonville, California
- Average monthly list price increase in 2021: +2.80% (4.7x greater than the national average)
- Median list price (October 2021): $1,250,000
- Statewide monthly list price increase: +0.3% (28th in the nation)
10. Longview, Texas
- Average monthly list price increase in 2021: +2.81% (4.7x greater than the national average)
- Median list price (October 2021): $286,450
- Statewide monthly list price increase: +1.4% (10th in the nation)
9. Kingsport, Tennessee
- Average monthly list price increase in 2021: +3.0% (5.0x greater than the national average)
- Median list price (October 2021): $272,000
- Statewide monthly list price increase: +1.3% (11th in the nation)
8. Carson City, Nevada
- Average monthly list price increase in 2021: +3.26% (5.4x greater than the national average)
- Median list price (October 2021): $565,000
- Statewide monthly list price increase: +2.6% (3rd in the nation)
7. Grand Forks, North Dakota
- Average monthly list price increase in 2021: +3.37% (5.6x greater than the national average)
- Median list price (October 2021): $253,000
- Statewide monthly list price increase: +1.6% (7th in the nation)
6. Bellingham, Washington
- Average monthly list price increase in 2021: +3.63% (6.1x greater than the national average)
- Median list price (October 2021): $600,000
- Statewide monthly list price increase: +1.5% (9th in the nation)
5. Terre Haute, Indiana
- Average monthly list price increase in 2021: +4.15% (6.9x greater than the national average)
- Median list price (October 2021): $129,900
- Statewide monthly list price increase: +1.6% (8th in the nation)
4. Elkhart, Indiana
- Average monthly list price increase in 2021: +5.0% (8.3x greater than the national average)
- Median list price (October 2021): $219,900
- Statewide monthly list price increase: +1.6% (8th in the nation)
3. Rapid City, South Dakota
- Average monthly list price increase in 2021: +5.85% (9.8x greater than the national average)
- Median list price (October 2021): $386,000
- Statewide monthly list price increase: +3.9% (1st in the nation)
2. Pocatello, Idaho
- Average monthly list price increase in 2021: +6.35% (10.6x greater than the national average)
- Median list price (October 2021): $400,000
- Statewide monthly list price increase: +3.8% (2nd in the nation)
1. Muncie, Indiana
- Average monthly list price increase in 2021: +7.37% (12.3x greater than the national average)
- Median list price (October 2021): $120,000
- Statewide monthly list price increase: +1.6% (8th in the nation)
If you have any questions or comments about this article or would like to request the data, please contact
More From 97.3 ESPN